

How To Read Market Breadth

Ignore market breadth if you want to get blind-sided by markets.
I don't think you can watch CNBC for an entire day without hearing the word breadth and broadening at least 5 times.
Learn what that means.
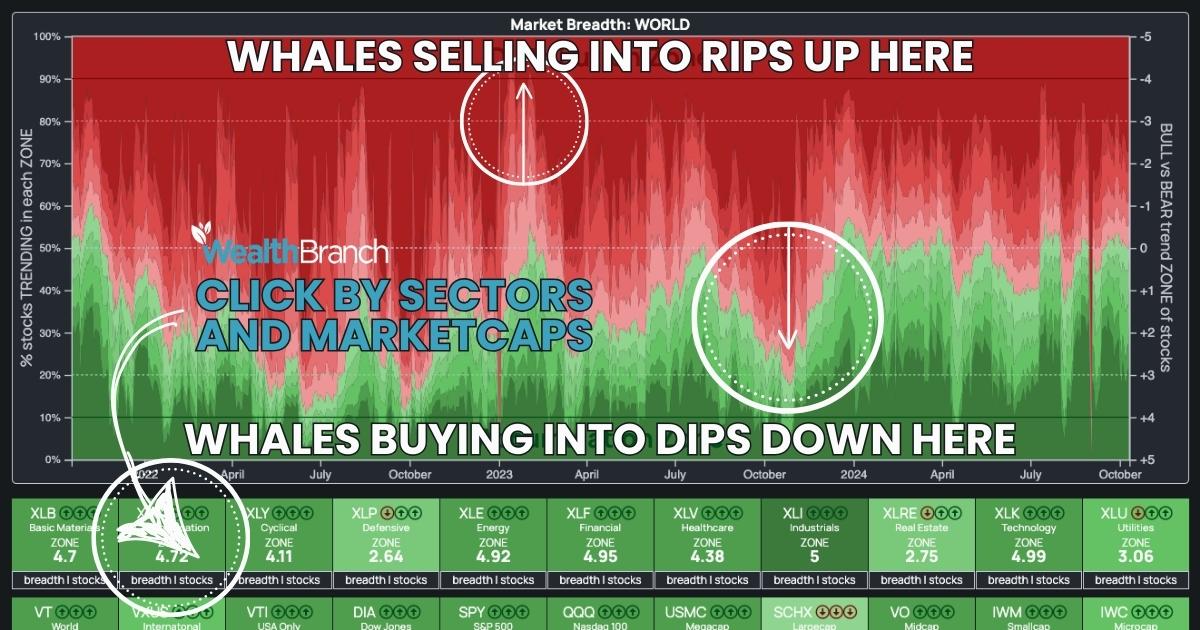
Use our breadth heatmap to see it in 3D.
Our ZONE data makes breadth come alive.
Breadth is like a river; a wider river supports more boats. - Edson Gould
Understanding Market Breadth: An Insight into Market Health
Market breadth is like checking the pulse of a crowd at a race. If most runners (stocks) are moving forward and gaining speed, the race (market) is in good health. But if only a few are pushing ahead while the rest slow down or fall behind, it signals potential trouble for the race as a whole. Just as you’d look at the whole crowd to assess how the race is going, market breadth helps you see how many stocks are advancing versus declining, giving you a clearer picture of the market’s overall direction and strength.

What is Market Breadth?
Market breadth evaluates how many stocks are involved in market movements. It shows whether a rally or decline is supported by many stocks or just a few major players. Strong breadth reflects widespread participation in market trends, while weak breadth shows reliance on only a handful of stocks.
Why is Market Breadth Important?
Assessing Market Health
Robust market breadth signifies that numerous stocks are moving in the same direction, indicating a stable market. Weak breadth, however, suggests that only a few stocks are driving the market, highlighting potential vulnerabilities in the underlying economy.
Identifying Trends
By monitoring market breadth, traders can see if current trends are sustainable. For instance, a rising market with only a few advancing stocks might signal an upcoming trend reversal. This can occur during tops or bottoms. There is only so much money to go around and if you keep an eye on how much of it is in the entire market versus previous periods in the past then you can assess when the big boys are leaning toward risk-on or risk-off consensus.
Predicting Market Reversals
Poor market breadth can warn of instability. Rising indices with many declining stocks may indicate that the rally won't last, pointing to a potential downturn.
Utilizing Market Breadth Tools
Various tools on platforms like WealthBranch can help you monitor market breadth:
- Market Breadth Tool: WealthBranch’s tool provides daily data on advancing versus declining stocks, helping you determine if the trend is broad-based or driven by a few. We take it to another level by analyzing ZONE levels.
- Advance-Decline Line: Our indicator tracks the difference between advancing and declining stocks over time not just overall but inside each WealthBranch ZONE level. It gives us a 3D view of the overall market as well as a granular view of each index, each sector and each marketcap level. Pretty powerful stuff yeah?
Is the Market Experiencing Bad Breadth?
To evaluate market breadth, observe:
- Index Performance Disparity: If indices like the S&P 500 or Dow Jones reach new highs while many stocks lag, it signals poor breadth.
- Declining Participation: Fewer advancing stocks paired with many declining ones indicate weak rally support, suggesting potential reversal risks.
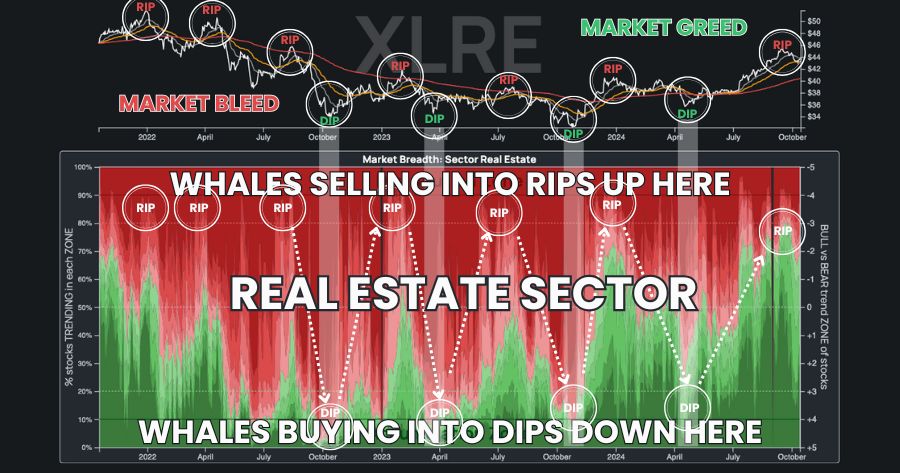
- Sector Performance: Strong performance in a few sectors while others lag may highlight broader market issues. Is money moving out of one sector and into another?
Try our market breadth tool
Market breadth is a vital measure of market strength and stability. By tracking advancing and declining stocks, traders can gain valuable insights into trends and anticipate possible reversals. Tools like the WealthBranch Market Breadth can keep you informed and enhance trading decisions.
Try our market beadth tool.