
Two Key Features To Analyze Historical LEAF Forecasts


LEAF analysis is magic. Well sort of.
We told you the LEAF is a daily snapshot.
We analyzed all these historical snapshots.
You can now view the BEST LEAFs in history.
This is how we forecast the data.
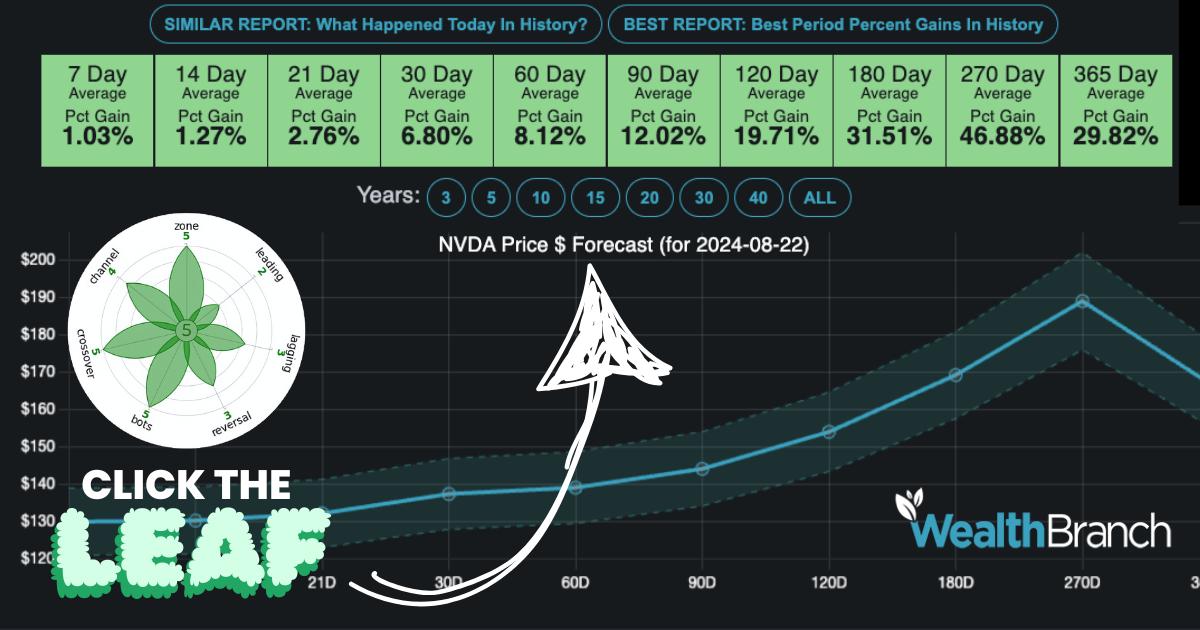
And you can click on the LEAF to find other trades TODAY!
There is nothing new on Wall Street. Whatever happens in the stock market today has happened before and will happen again. - Jesse Livermore
What if you could know how an asset performed based on its unique trading profile?
That would be awesome, right?! We thought so too. That’s why our software not only helps you find trades but also lets you see how they performed in the past.

This isn’t just the historical return based purely on price—information you can get anywhere. Instead, we provide the percentage return based on each stock’s unique trading volatility and technical pattern. Imagine the power of trading with insights tailored specifically to the behavior of the asset you’re interested in.
Say goodbye to guesswork and uninformed decisions. Our platform equips you with the critical insights you need to make smarter, more profitable trades.
Here is how it works:
If you click on the LEAF, a popup will appear with two historical reports. The first report is "What happened today in history?" showing the historical averages for the stock price based on the current LEAF indicator pattern happening RIGHT NOW.
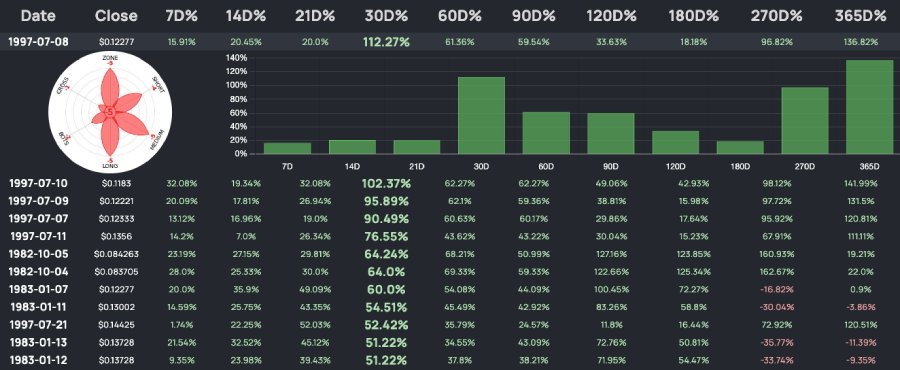
Additionally, you can click the "Best Period Percentage Gains in History" button to view the best-performing LEAF indicator patterns in the history of the asset.
BUT wait there is more... you can change the time period you are looking at to the last 5 years or last 40. Filter the results to match your preference.
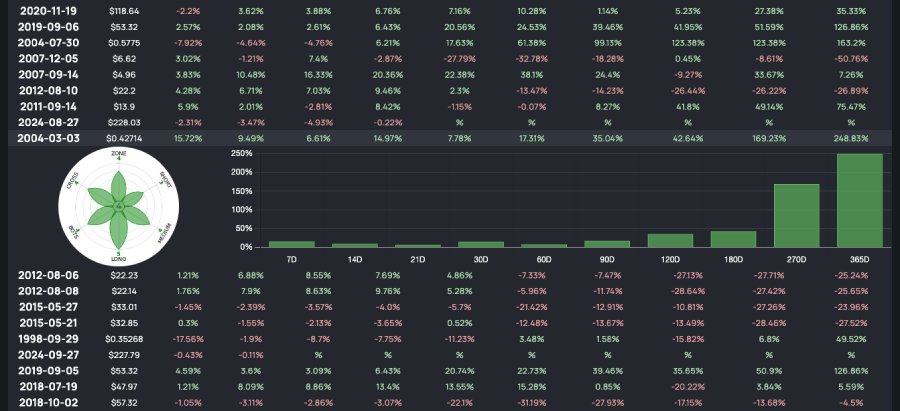
In the popup table of data, you are presented with dates from the past with the actual percent moves that occurred from that date. The top of the table shows the averages which is what predicts the forecasts. Each asset has its own "personality" and you can browse most of the history of the entire stock.
Here is what AAPL did from 2004-03-03. 248% in 365 days. See the snapshot of the LEAF on that day? Click the LEAF to see stocks today with a similar pattern.
Here is the BEST 30 day period in AAPL history (112%) and a snapshot of the LEAF. Do you see the LEAF on that day? Click the LEAF to see stocks TODAY with a similar pattern.