

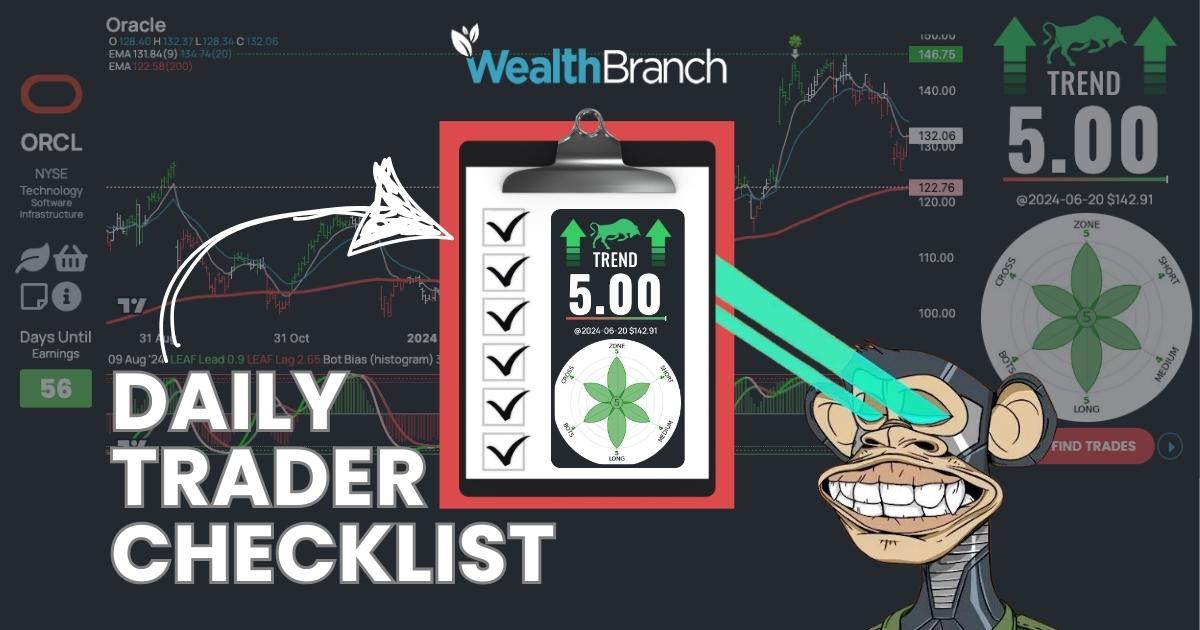
The Daily Trader Checklist

Develop a daily routine. You can borrow ours.
A routine ...
- A routine removes unnecessary decisions from your day.
- A routine builds consistency in your actions.
- A routine fosters discipline and helps you stay focused.
- A routine turns small steps into long-term success.
- A routine provides structure and direction for your day.
- A routine helps develop good habits over time.
- A routine keeps you accountable to your goals.
- A routine makes progress feel automatic.
- A routine helps manage time more effectively.
- A routine reduces mental fatigue by creating predictability.
Without a routine, even the most talented people will struggle to succeed. — Stephen Covey
In today's fast-paced markets, staying informed is crucial for making sound trading decisions. WealthBranch offers powerful tools to keep you up-to-date and ahead of the curve. Here’s how you can leverage our platform to stay informed and make better trading decisions.
The Checklist
We use this daily checklist to help us find trades and ensure we don’t get crushed by a tidal wave trend against us.
- Check the News and News Sentiment Score.
- Check Economic Calendar.
- Check Market Breadth.
- Check the Daily Macro Economic Report
- Pick a Strategy (Buy The Dip)
- Review the LEAF and ZONE Indicator.
- Review the Trade Protect Score
- Check for upcoming (Earnings).
- Check the volatility percentage.
- Review the historical average.
- Bonus: Review potential stop losses.
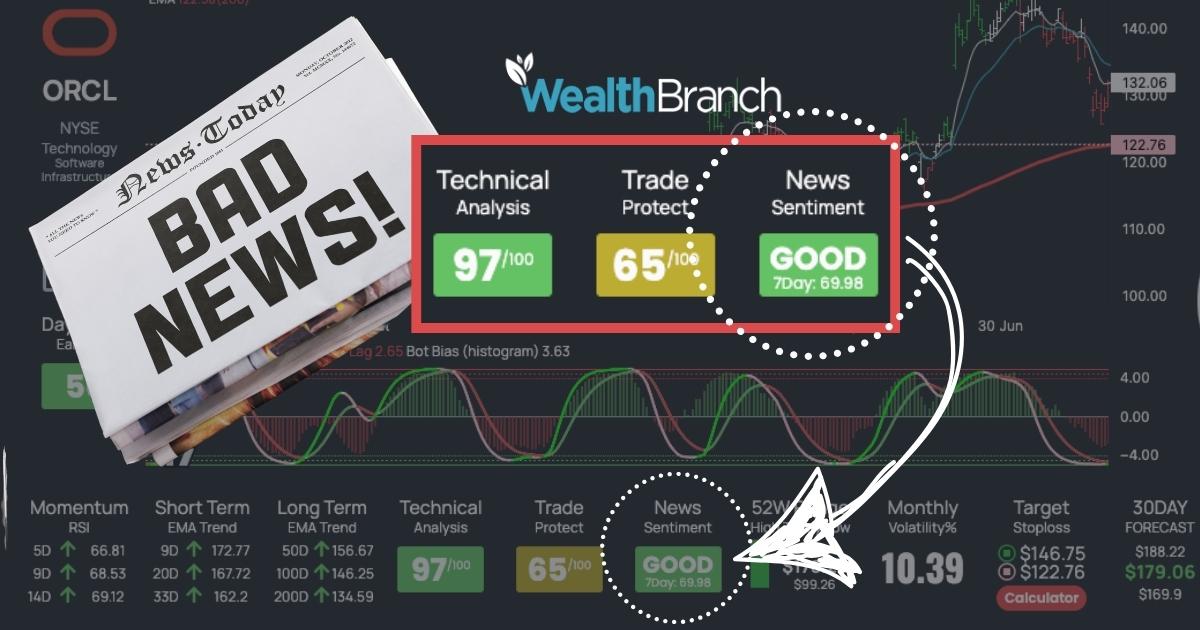
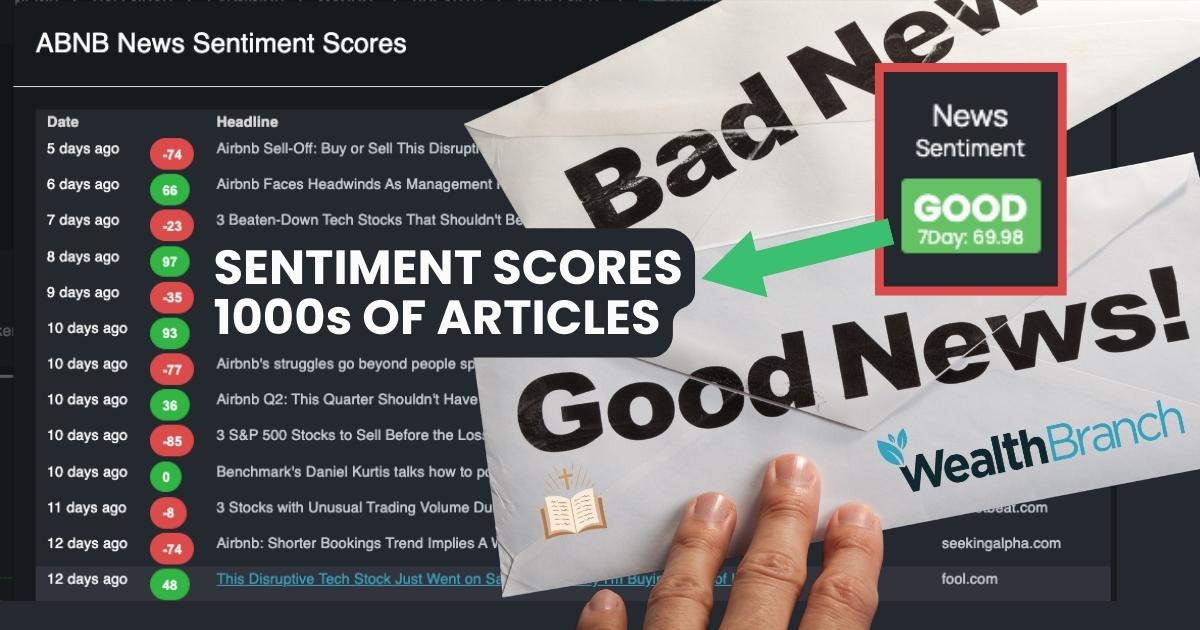
Check the News and News Sentiment Score
Want unbiased news untainted by algorithms? Check out our news page for the true pulse of what's happening.

With WealthBranch, access the latest news and sentiment scores for each stock, helping you quickly gauge market sentiment. Use these insights to adjust your strategy, whether the sentiment is bullish or bearish.
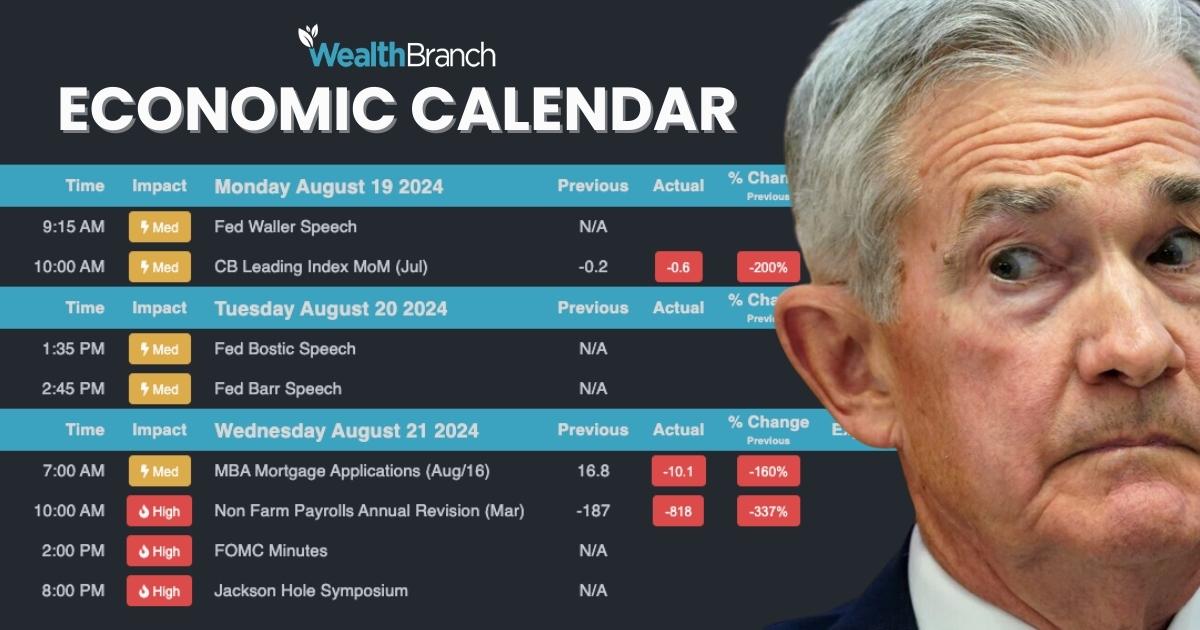
Keep an Eye on the Economic Calendar
Stay informed on news and economic indicators that affect market trends, like interest rate changes and geopolitical events. Use the WealthBranch Economic Calendar to track upcoming events, categorized by impact, to anticipate market fluctuations. These events are categorized by their potential impact: low, medium, and high. Pay special attention to high-impact events like Federal Reserve announcements, as they can cause significant market fluctuations.
Monitor Market Breadth
Does the market or an index or a single sector have BAD breadth?
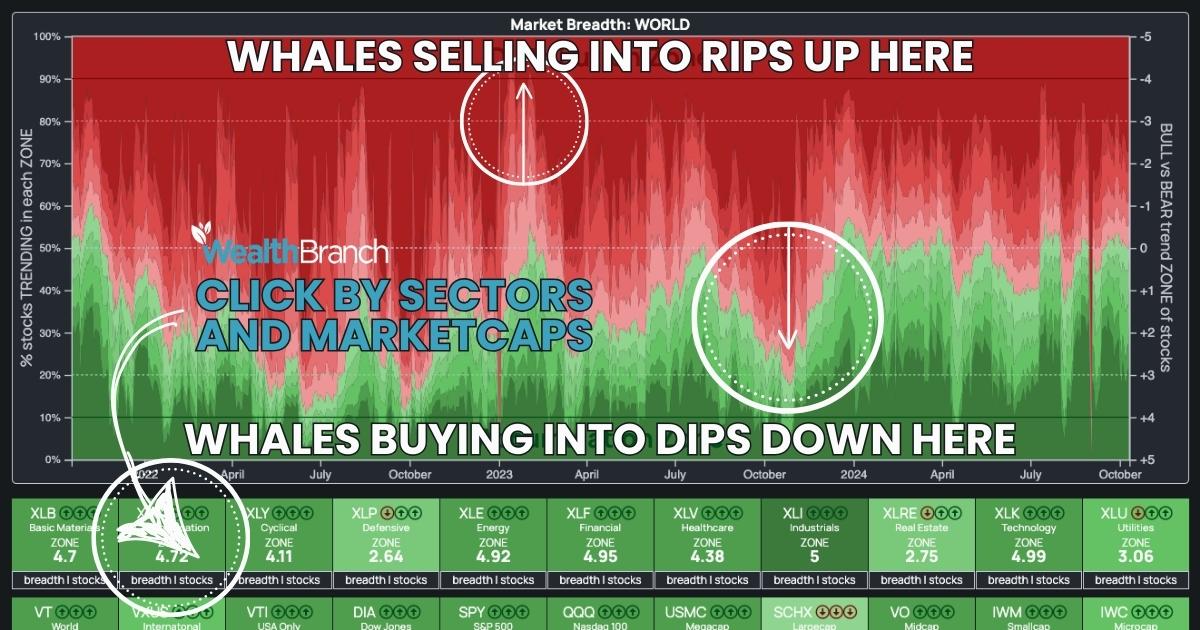
Market breadth is a crucial indicator of overall market health, showing the number of advancing stocks compared to declining ones. Monitoring market breadth helps understand broader market trends. Access the Market Breadth tool on WealthBranch to gauge overall market performance.
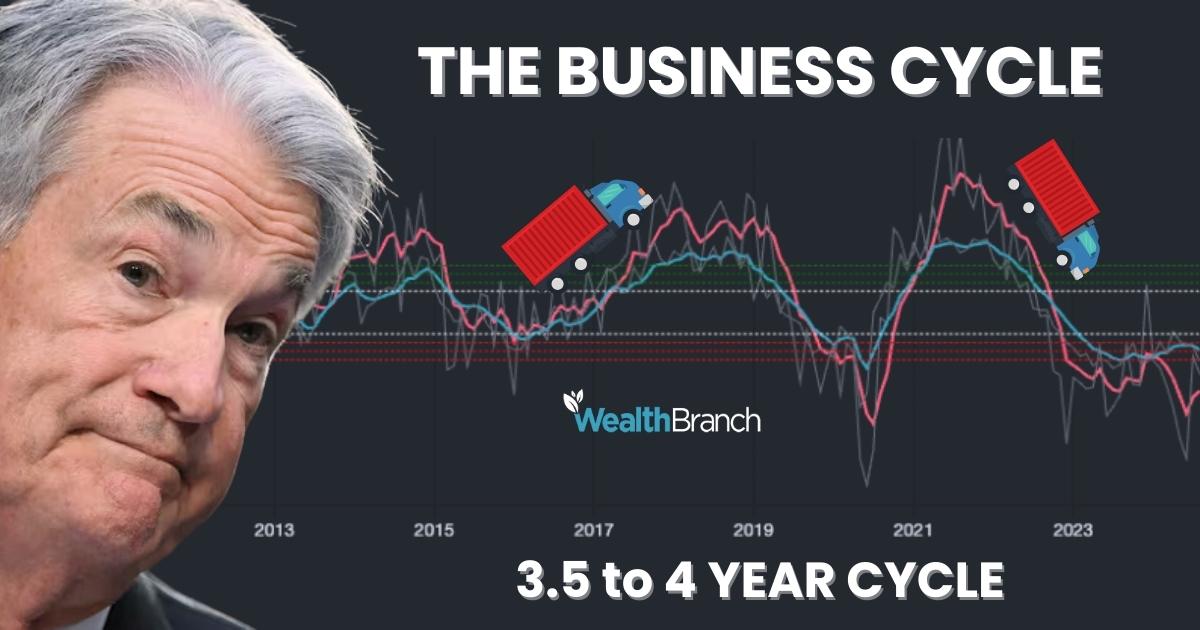
Macroeconomic Trends
When I first delved into trading, the avalanche of financial news and YouTube analysts overwhelmed me. This information overload often led to impulsive decisions and losses. I was trading against major market trends, which resulted in unprofitable outcomes.
However, my trading strategy transformed dramatically when I started focusing on macroeconomic trends. Shifting my attention to these broader economic factors made a world of difference. Staying informed about these trends is crucial. For the latest updates, be sure to check out our daily posts.
Pick a Strategy
Various trading strategies cater to different individuals' goals and risk tolerances. The most straightforward approach to understand is "Buy The Dip," but several others are available on our site.
- Fade The Rip
- Knife Catcher
- Bullish Zones
- Bearish Zones
- Double Death
- Double Golden Cross
The important thing here is to pick a strategy you fully understand and know how the strategy typically trades.
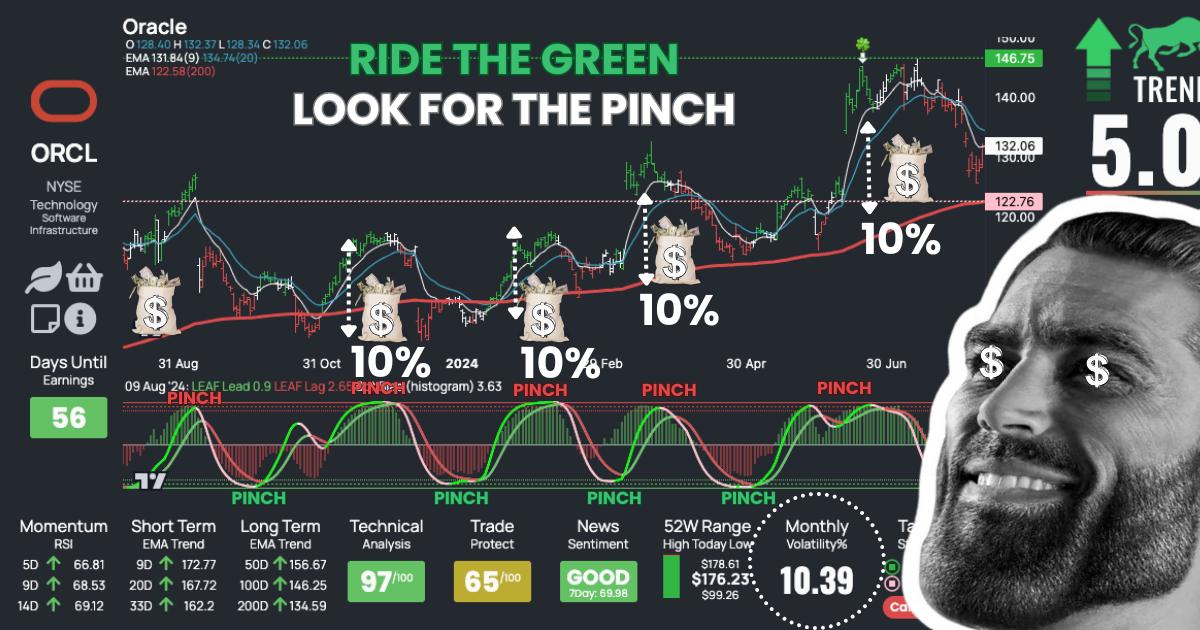
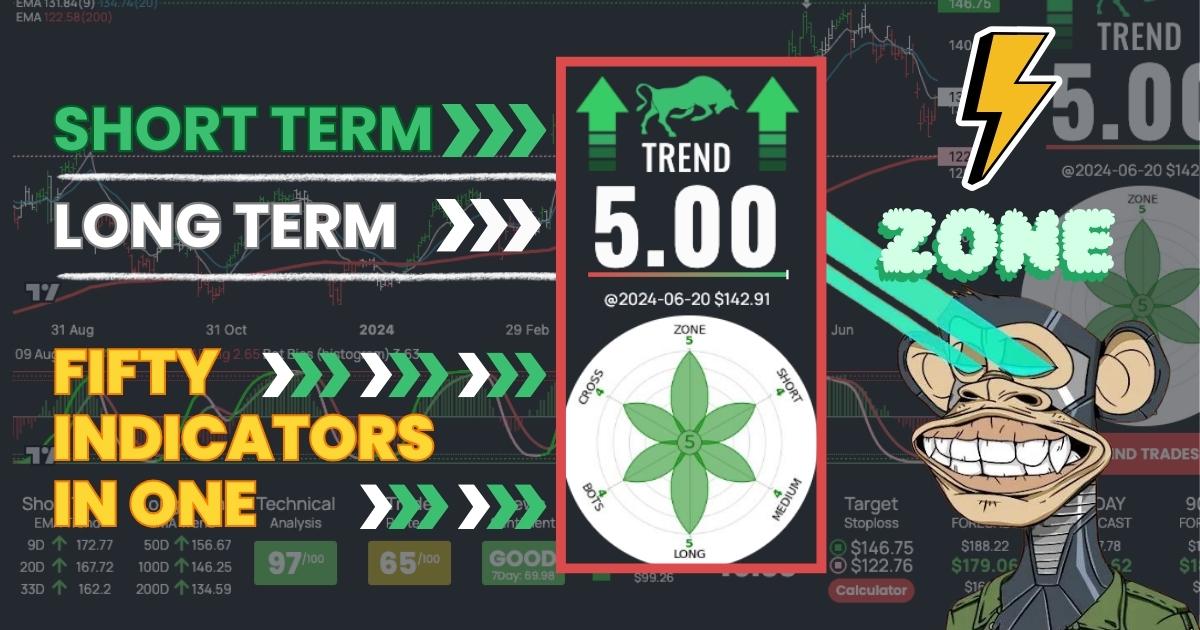
LEAF & ZONE Indicator
The LEAF indicator helps traders identify the type of trade setup they are looking at and find trades with a similar trade setup.
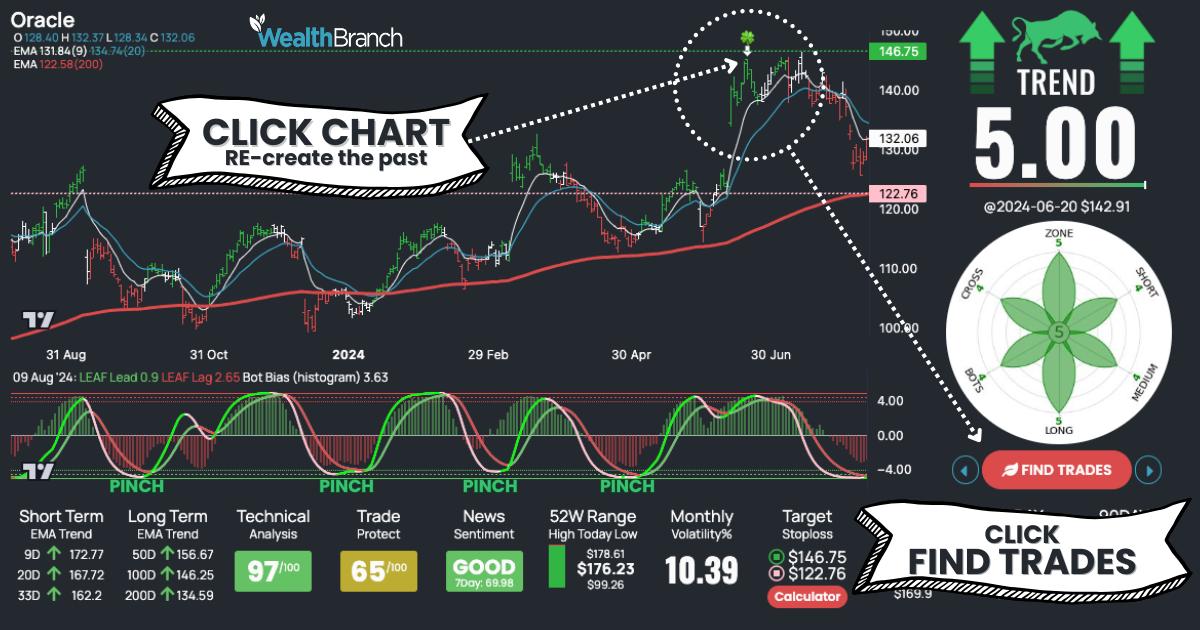
The ZONE Indicator reviews over 50 traditional trading indicators such as RSI, MACD, etc. In addition, it takes into account price action and several other factors to determine how overbought or oversold a stock is, similar to what trading bots would use for algorithmic trading.
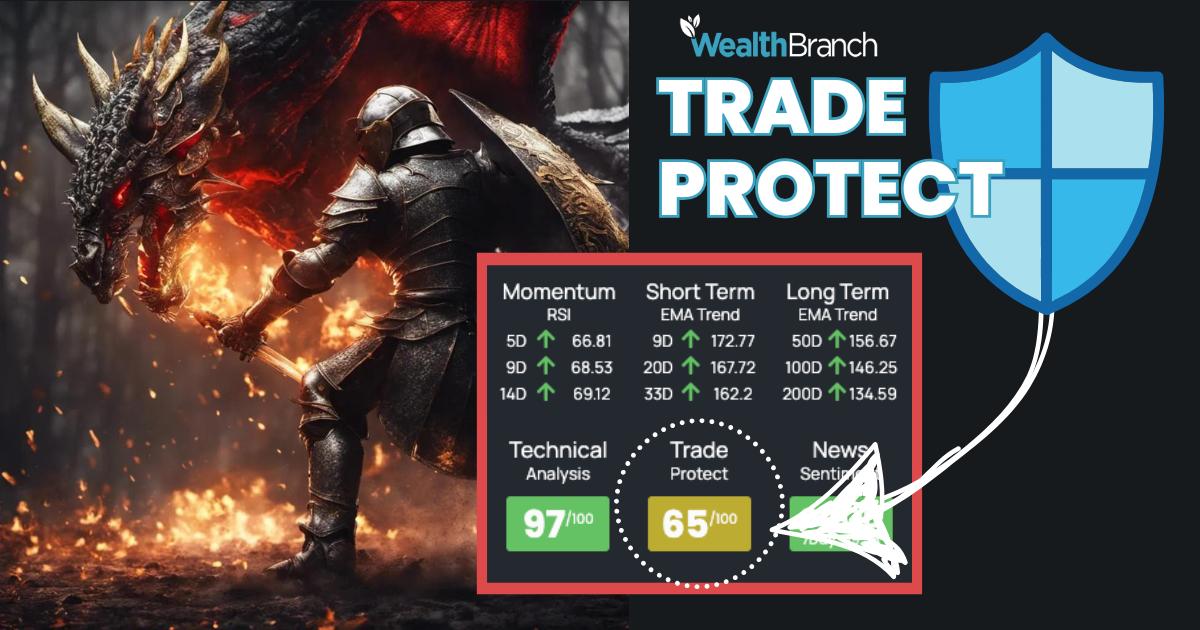
Trade Protect
Trade Protect helps traders avoid investing in potentially bankrupt companies by ranking stocks with the highest scores at the top. It's a quick indicator, but it's important to conduct your own research and check the company's fundamentals before making any trades.
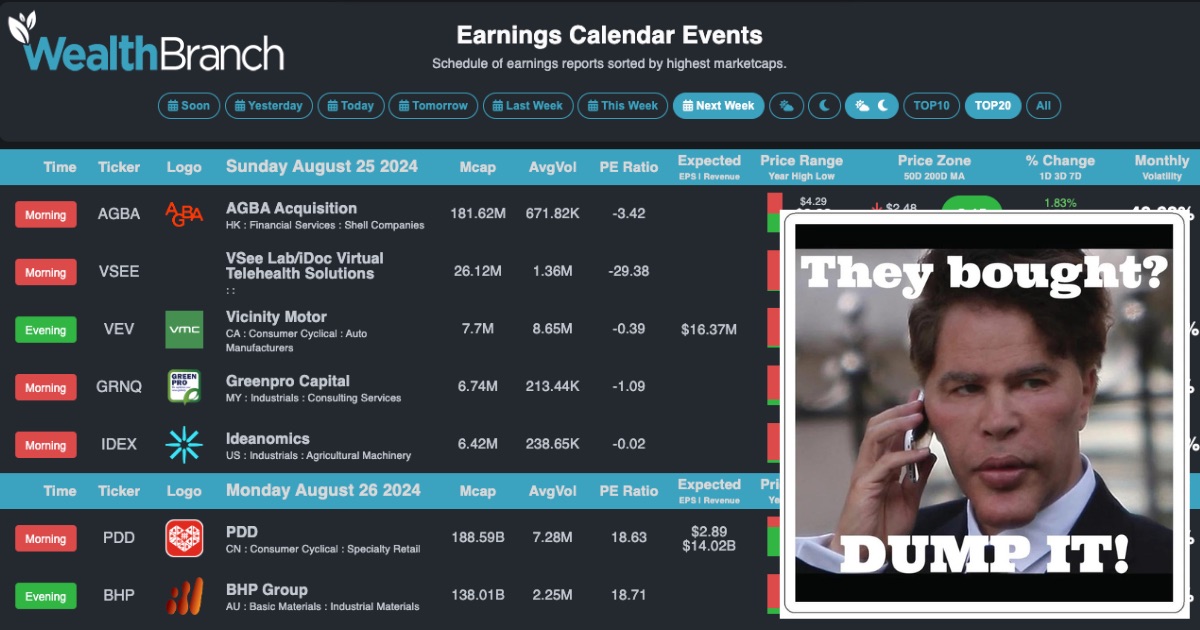
Earnings Calendar
It’s often a good idea to check the Earnings calendar. In addition, check out our article about the importance of checking earnings before trading.
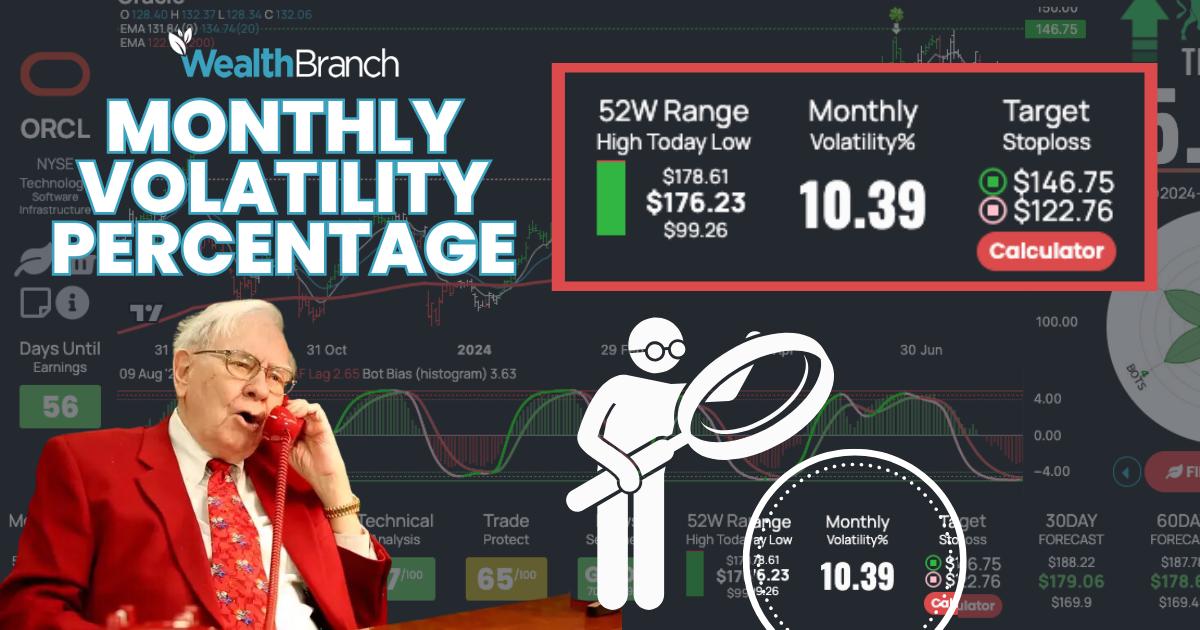
Monthly Volatility Percentage
Monthly volatility shows the average price movement of an asset. For example, a 10% monthly volatility means the stock typically fluctuates 10% each month. A savvy trader might notice a stock trading 40% below its recent highs, confirm an uptrend with a +1.00 ZONE number, and make a trade. They could aim for a short-term 10% gain or part of a long-term 40% profit.
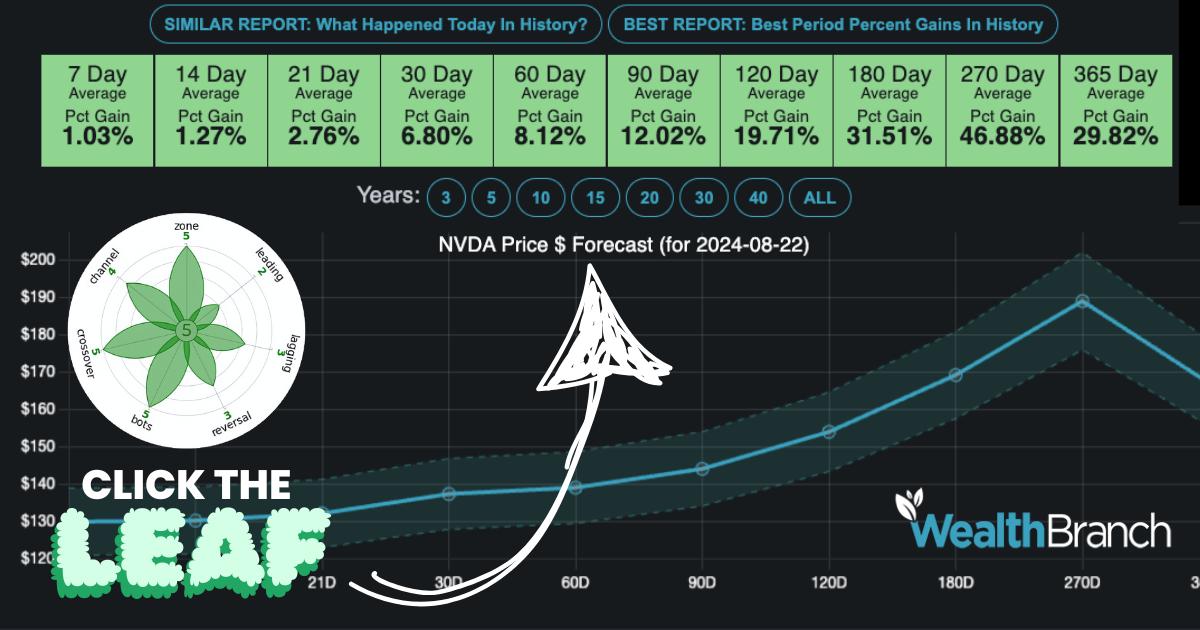
Check The Historical Averages
If you click on the LEAF, a popup will appear with a report showing the historical averages for the stock price based on the current LEAF indicator pattern. Additionally, you can click the "BEST REPORT: Best Period Percentage Gains in History" button to view the best-performing LEAF indicator patterns in history.
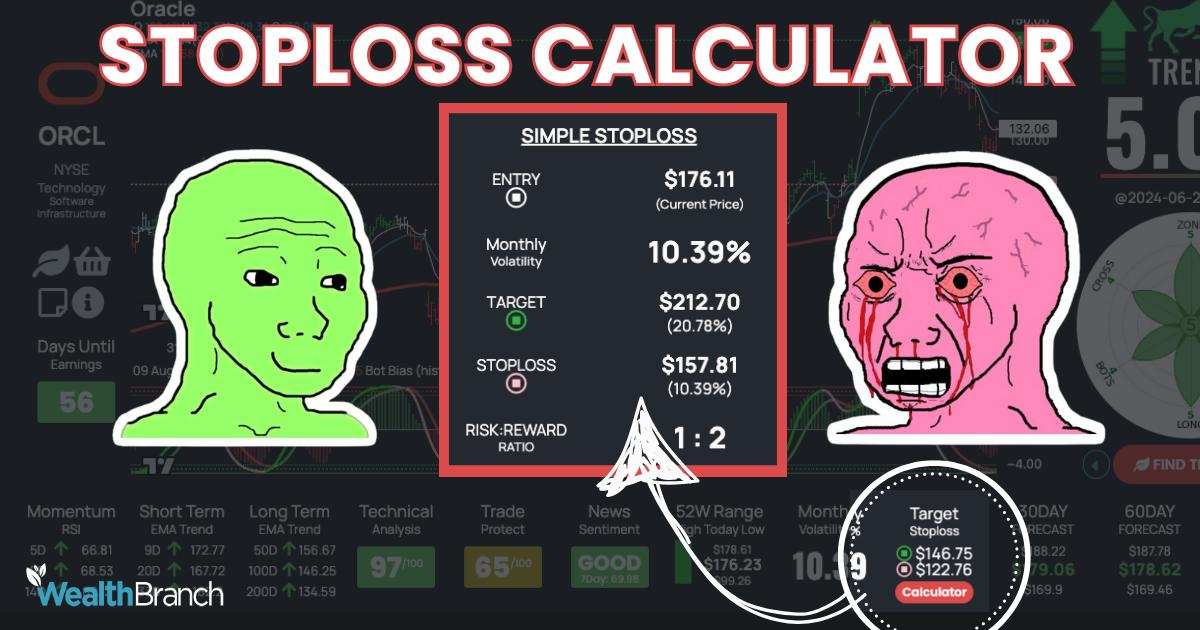
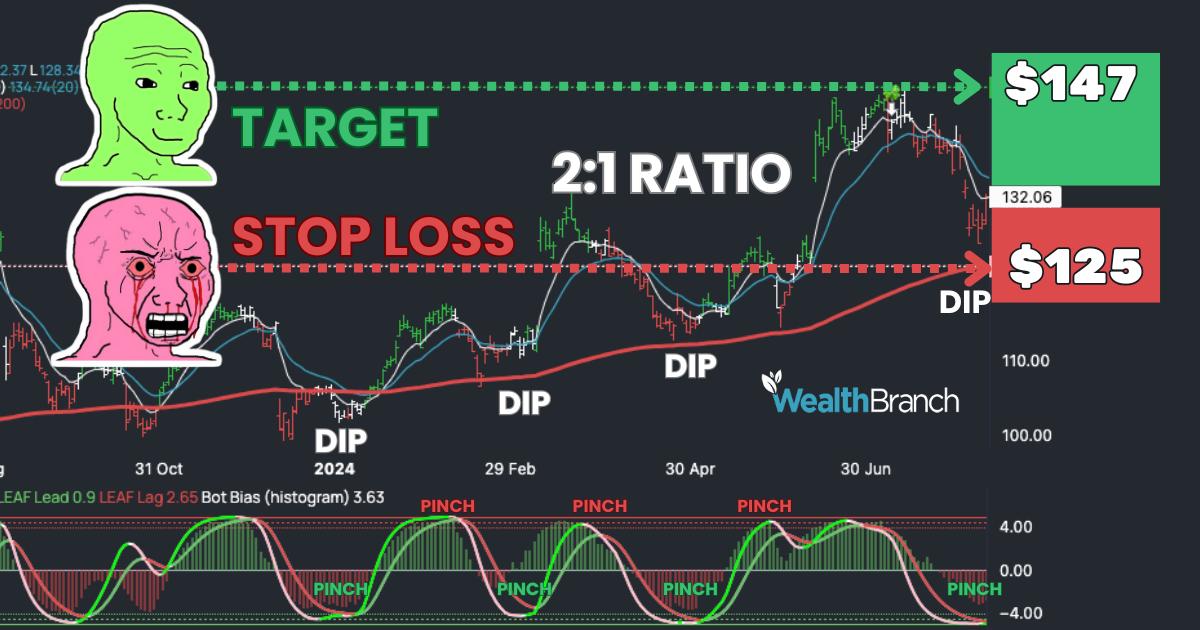
Review Stop Loss Calculator
We automatically calculate a 2-to-1 win-to-loss ratio and draw a line on the chart, but you can update this to a better win-to-loss ratio. Some great traders only risk a small amount of capital on 5-to-1 trades.
By following these steps everyday, you can better navigate the stock market and make more informed decisions in your trading journey.